PAID GROWTH INSIGHTS
Clearer thinking for businesses investing in paid growth.
I write about what happens when ads, tracking, landing pages, messaging, offers, and customer behavior do-or do not-work together.
These are practical observations from inside real accounts, built to help established businesses understand what the data is actually saying and make better decisions before putting more money behind the system.

START HERE
A few places to begin when paid growth feels harder to read.
These articles cover the patterns I see most often: unclear tracking, leaks after the click, and decisions being made from platform activity instead of real business movement.
PAID GROWTH STRATEGY
What I look at before making major campaign changes—and why the ad account alone rarely tells the whole story.
CUSTOMER PATH & CONVERSION
How to recognize when campaigns are generating traffic but the website, offer, or conversion path is failing to carry people forward.
CASE STUDY
A closer look at what changed when stronger performance signals helped guide budget and optimization decisions.
EXPLORE BY GROWTH QUESTION
Find the part of paid growth you are trying to make sense of.
What are the numbers really saying?
Tracking, attribution, lead quality, revenue signals, and understanding platform performance in the context of the business.
Tracking & Performance
What is happening after the click?
Landing pages, offers, messaging, follow-up, conversion friction, and the gaps between traffic and meaningful action.
Customer Path & Conversion
What needs to change before scaling?
Budget decisions, testing priorities, campaign structure, offer readiness, and the proof needed before increasing spend.
Paid Growth Strategy
What can we learn from real accounts?
Case studies, performance observations, strategic decisions, and the context behind measurable results.
Case Studies & Field Notes
LATEST PAID GROWTH INSIGHTS
Observations, case studies, and lessons from inside the work.
Not every performance problem needs another campaign. Sometimes the next move is better tracking, a clearer message, a stronger landing page, or a more honest read of what the customer is doing.
What Are Competitive Metrics
Why Understanding Competitive Metrics in Google Ads Changes Everything
Ever looked at your Google Ads dashboard and thought, “Why isn’t my ad showing up more often?”
You’re not the only one. Every business owner hits that moment — staring at the numbers and wondering what’s actually going on behind the scenes.
The truth?
There’s a quiet little section inside your account that holds all the answers: your Competitive Metrics.
Think of it like your ad’s report card — showing how often you show up, how often you win, and what’s standing between you and more visibility.
Let’s unpack this together.
What Competitive Metrics Actually Tell You
Competitive Metrics aren’t about how people react to your ad — they show how often your ad even gets the chance to be seen.
Here’s what each one means in plain English:
Search Impression Share (IS) – How often your ad appeared out of all the times it could have.
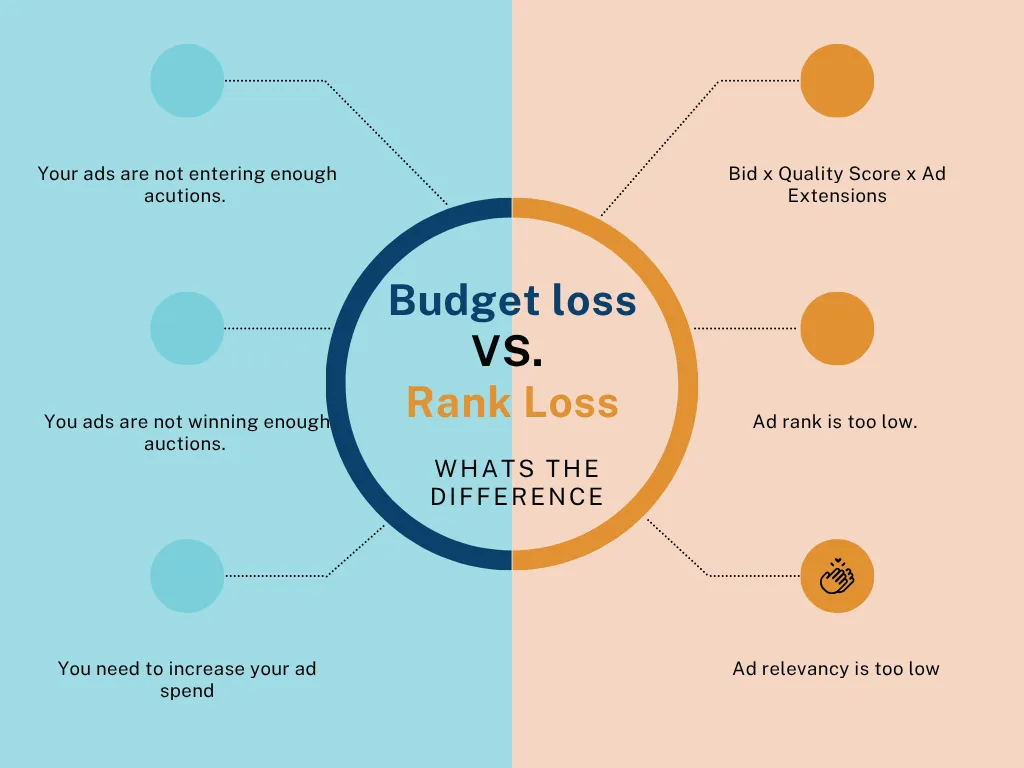
Search Lost IS (Budget) – How often your ad didn’t show because your budget ran out.
Search Lost IS (Rank) – How often your ad didn’t show because your Ad Rank wasn’t high enough — meaning your ad wasn’t as competitive in the auction.
In short:
Budget loss = you’re not entering enough auctions.
Rank loss = you’re entering auctions, but not winning them.
Why These Numbers Matter (More Than You Think)
Most advertisers only focus on clicks, CTR, and conversions — but those metrics only tell you what happens after someone sees your ad.
Competitive Metrics tell you the part that comes before:
👉 how often Google is even giving your ad a chance to show up in the first place.
Here’s a quick example:
If your Search Lost IS (Rank) is 80%, that means you’re missing 8 out of every 10 potential impressions — not because of budget, but because Google doesn’t see your ad as the most relevant or competitive in the auction.
That’s not a spending issue.
That’s a visibility issue — and it’s one you can fix with strategy.
How to Read (and Fix) the Metrics Like a Pro
Search Impression Share : % of times your ad appeared when eligible
What to do: If it’s under 50%, investigate. You’re not getting enough visibility.
Lost IS (Budget): Your ad ran out of budget before showing more
What to do: Consider a small budget increase or adjust ad scheduling.
Lost IS (Rank): Your ad didn’t rank high enough to show
What to do: Focus on ad relevance, CTR, and landing page quality.
Top of Page % : How often your ad appeared above organic results
What to do: Use this to measure your visibility growth over time.
If Rank Loss is high (60–80%+), try:
Refreshing ad copy to better match search intent
Tightening keyword-to-headline alignment
Adding extensions that make your ad more clickable
Improving Quality Score with stronger relevance and user experience
The Real Magic: Clarity Over Guesswork
Once you start using Competitive Metrics, you stop guessing — and start knowing where to focus.
You’ll be able to clearly see:
- Whether you need to raise your budget or raise your quality
- Whether visibility is lost because of money or message
- Where small, strategic moves can compound into bigger wins over time
When you check these metrics weekly, you stop reacting emotionally to surface-level numbers — and start managing your ads like an investor who’s in it for long-term growth.
My Go-To Rules of Thumb
When I audit a Google Ads account, here’s what I look for right away:
Lost IS (Budget) over 30% → Check pacing or consider a modest budget bump.
Lost IS (Rank) over 60% → Refine messaging, keywords, and landing page alignment.
Both are high → It’s usually a blend of creative + budget strategy that needs tweaking.
You can’t fix what you don’t see — and these metrics give you full visibility into what’s actually happening before the click.
Final Thoughts
Running Google Ads isn’t about who spends the most — it’s about who shows up most relevantly.
Your Competitive Metrics are like a compass.
They show you exactly where to focus — whether it’s improving ad quality, tightening targeting, or increasing budget — so your spend actually works for you.
Because your ad performance isn’t a mystery…
Google literally gives you the roadmap.
You just have to know how to read it.

LOOKING FOR THE PROOF BEHIND THE THINKING?
See how these decisions show up in real campaign performance.
The articles explain how I think about paid growth. The case studies show what that thinking looks like when it is applied across campaign strategy, tracking, customer behavior, landing pages, and budget decisions.

Blending Growth with innovation.
Navigation
Contact Us
Call Or Text: (916) 318-0373


© 2026 LN Marketing Services. All Rights Reserved