META ADS CASE STUDY
How a small Meta Ads budget became a testing system for better lead generation
This established local home service business didn’t have a massive advertising budget -which meant there wasn’t much room for guessing.
Instead of simply spending more, I used the account to test audiences, messaging, creative, and campaign settings to understand what was actually generating a response.
The result was an account that became more intentional over time, with clearer signals about what to keep, what to change, and where the next advertising dollar should go.
CLIENT
Established Local Home Service Business
PLATFORM
Meta Ads
FOCUS
Lead Generation + Campaign Testing
STRATEGY
Audience, Messaging, Creative + Optimization
FREE GOOGLE ADS CASE STUDY
The account didn’t need more changes. It needed better signals.
See how I used performance data to decide which audiences, messages, creatives, and campaign settings deserved the next test.
Inside the free case study:
the campaign performance over time
which changes produced stronger signals
what happened when Meta automation hurt efficiency
how stronger messaging was carried into weaker ads
why I moved toward a more manual campaign setup
what the account taught me beyond clicks and engagement
01 THE CHALLENGE
The account was generating activity. But the budget left very little room for guessing.
Meta Ads was already generating clicks, traffic, and leads for this local home service business.
But performance wasn’t consistent.
Some audiences and messages were connecting. Others were using budget without producing the same response.
Simply spending more wasn’t the answer.
I needed to understand which parts of the account were actually creating stronger lead signals, the audience, the message, the creative, or the campaign settings and use that information to decide what deserved the next test.
THE REAL GOAL
The goal wasn’t simply to generate more activity.
It was to turn a limited Meta Ads budget into a testing system that could show us what was working, what needed to change, and where the next advertising dollar had the best chance of producing a lead.
40
Platform conversions reported*
$22.25
Best Documented Weekly Cost per Conversion
6
Conversions in the Strongest Reporting Period
5.75%
CTR Reached in a Standard Weekly Reporting Period
*Across reporting periods where conversion data was available.
02 THE STRATEGY
The strategy shifted from making more changes to making better decisions.
The account didn’t need constant rebuilding every time performance moved.
It needed a clearer testing process.
Instead of changing audiences, creative, messaging, and campaign settings all at once, I started using each performance signal to decide what variable deserved attention next.
That made it easier to understand what was actually helping the account, and what was only creating more activity.
01
TESTED THE AUDIENCE
Different homeowner and service-based audiences were tested to understand which groups were giving the ads a stronger chance of producing a lead.
02
FOLLOWED THE MESSAGE
When one ad started connecting better, I used the stronger messaging pattern to guide changes in the weaker-performing ads instead of starting over.
03
REFRESHED THE CREATIVE
Carousel graphics, images, headlines, and later creative formats were refreshed as performance changed — including testing carousel versus Reel.
04
QUESTIONED THE CAMPAIGN SETTINGS
When a Meta-recommended setting increased impressions but weakened clicks and lead efficiency, I reversed it and moved back toward the setup the data supported.
03 THE RESULTS
The campaigns generated leads. The stronger result was learning what actually improved performance.
Across the reporting period, Meta recorded 40 conversions during the weeks where conversion data was available.
But the useful part wasn’t just the lead count.
Looking at cost per conversion, CTR, creative performance, audience response, and campaign changes showed which decisions were actually making the account more efficient, and which ones needed to be reversed.
LEAD GENERATION
40
Platform-recorded conversions across reporting periods with conversion data
6
Conversions in the strongest documented reporting period
4 Phone Calls
Captured in one later reporting period even when no standard Meta lead was recorded
PERFORMANCE SIGNALS
$22.25
Best documented weekly cost per conversion
5.75%
CTR reached during a standard weekly reporting period
$0.52
Cost per click reached during that same strong October reporting period
The win wasn’t simply generating more leads. It was building a clearer picture of what was actually helping the account perform.
That meant using the data to refine audiences, carry stronger messaging into weaker ads, refresh creative when performance softened, and reverse campaign settings when Meta’s automation made the account less efficient.
Meta Ads metrics reflect historical platform-reported performance. Conversion totals represent reporting periods where conversion data was available. Phone-call activity was tracked separately. Results do not represent verified closed jobs, revenue, or ROAS.
04 BEHIND THE RESULT
The account didn’t improve all at once the stronger signals came from specific tests.
Looking at the account as a whole would have hidden an important part of the story.
Some audiences responded better than others. Some creatives pulled stronger engagement.
Some campaign settings improved efficiency, while others made the account heavier and less effective.
That meant the next decision wasn’t simply whether Meta Ads was “working.” It was understanding which combinations of audience, creative, messaging, and settings were creating the strongest response.
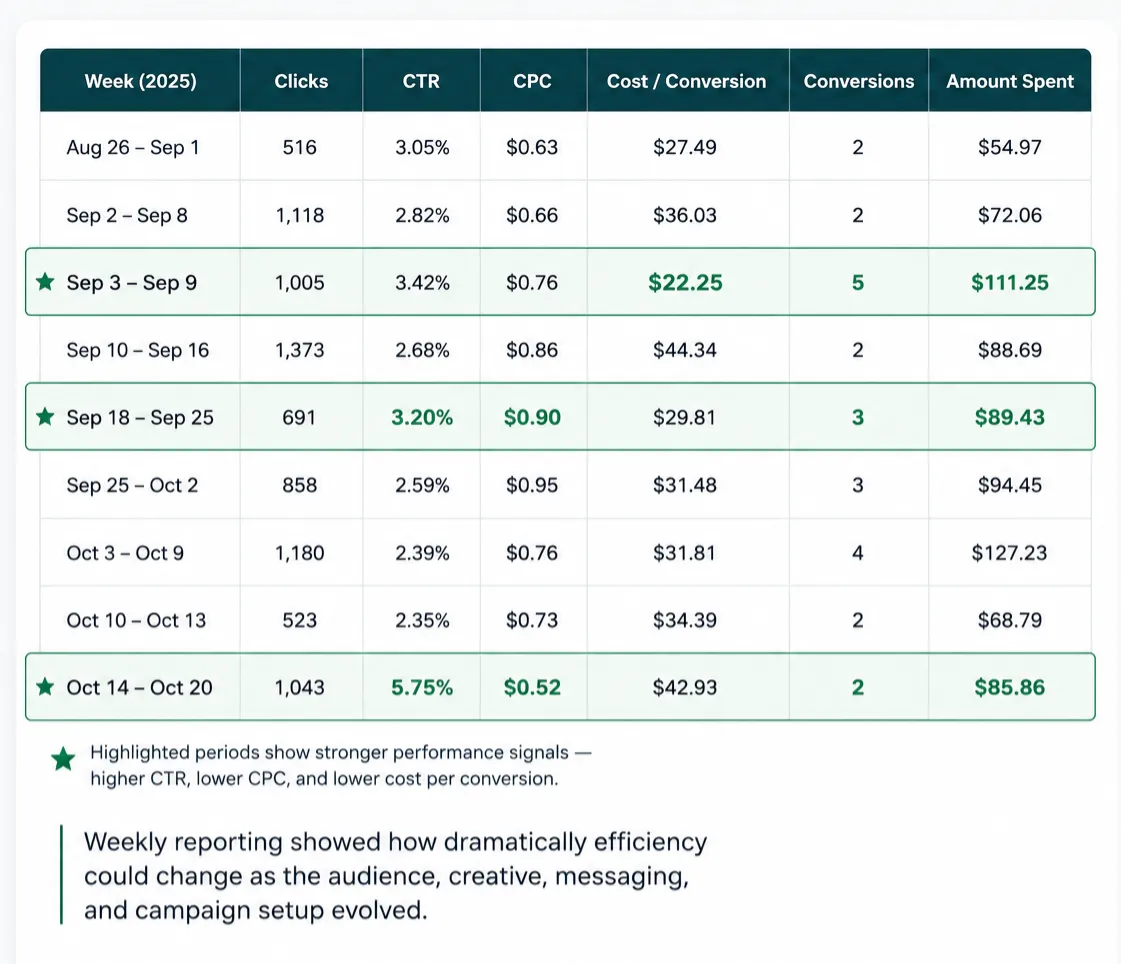
Weekly reporting showed how dramatically efficiency could change as the audience, creative, messaging, and campaign setup evolved.
What the account data revealed
Performance changed meaningfully across different reporting periods.
The strongest documented period reached $22.25 cost per conversion, with 5.75% CTR and $0.52 CPC, a much more efficient combination of traffic and response.
Other periods still generated activity, but the account was not equally efficient all the time.
Looking at performance this way made it easier to see what to keep, what to refresh, and what to reverse when Meta’s automation or creative mix was no longer helping.
Why this mattered
The account couldn’t be judged by total conversions alone.
The stronger signal was understanding what kind of setup was producing better lead activity at a more efficient cost. So the next decisions could be based on performance patterns, not just surface-level numbers.
01
LOOK BEYOND TOTAL LEADS
Weekly conversion count was useful, but it didn’t explain why performance was changing. CTR, CPC, cost per conversion, creative response, and lead activity gave a much fuller picture.
02
FOLLOW THE STRONGER SIGNAL
When one message, audience, or setup started outperforming another, I used that pattern to guide the next test instead of starting over.
03
LET PERFORMANCE GUIDE THE NEXT MOVE
The goal became knowing what to keep, what to refresh, and what to reverse, so budget decisions were based on what the account was actually proving.
05 WHAT CHANGED
The account stopped treating every performance change like a reason to start over.
Meta could tell me when someone clicked, engaged, or converted. But those numbers alone didn’t explain why one period performed better than another.
By comparing audience response, messaging, creative, campaign settings, and lead efficiency over time, the account became much easier to optimize based on patterns instead of reactions.
Before: platform activity was the main signal
The account was being judged largely by:
Total conversions
Cost per click
Click through rate
Reach and Impressions
Overall surface level campaign performance
Those numbers showed what happed but not what caused the change.
After: performance patterns guided the next test
The account was evaluated against:
Cost per conversion
Audience and messaging response
Creative performance
Changes in campaign settings
Which ads were actually producing leads
Customer actions beyond the standard Meta lead event
That made it easier to decide what to keep, what to change, and what deserved the next dollar.
The account moved from asking “Did performance go up or down?” to “What changed AND what does that tell us to test next?”
06 THE BIGGER LESSON
More activity does not automatically mean better Meta Ads performance.
A Meta Ads account can generate clicks, engagement, and conversions while still leaving an important question unanswered:
What is actually causing the stronger performance?
In this account, the useful insight came from comparing what changed across audiences, messaging, creative, and campaign settings not just watching whether the conversion count went up or down.
That changed how the account could be evaluated and where the next optimization decision should come from.
The better question is not always:
“Did the campaign generate more conversions?”
Sometimes it is:
“What changed — and which signal is strong enough to guide the next test?”
The ad account showed the activity. The performance patterns gave that activity context.
40
Platform-Recorded Conversions*
$22.25
Best Documented Weekly Cost per Conversion
5.75%
CTR Reached in a Strong Reporting Period
*Across reporting periods where conversion data was available.
The strongest insight was not one individual metric. It was understanding how audience response, creative, messaging, and campaign settings worked together and using those patterns to make the next decision with more confidence.
The numbers mattered → but knowing why the numbers changed is what made the account optimizable.
READY FOR A CLEARER READ ON YOUR LEADS?
Your campaign may not need more leads. It may need a better way to identify which ones are actually helping the business grow.
I look beyond the ad dashboard and connect the campaign to the landing pages, tracking, customer path, booked calls, lead quality, and verified business outcomes.
The goal is to understand what is working, what is leaking, and where the budget can be used more efficiently before more money goes behind it.

80%
As of December 2023,
80% of global businesses use Google Ads for their Pay-per-Click (PPC) campaigns.

65%
of small to mid-sized businesses also use PPC campaigns.

In 2022
Google's ad revenue in the U.S. was $224.47 billion
Built for businesses that already have something working
The best fit clients are not starting from zero. They already have demand, customers, or existing ad activity but need a clearer view of what is driving growth and where the customer path may be leaking.
A strong fit
Your business is already generating leads or sales
You are actively investing in Google or Meta ads
You have enough budget and room to test
You are open to improving landing pages, messaging, and tracking
You want strategy tied to real business outcomes
Probably not the right fit yet
You are relying on ads to prove an untested offer
You want campaign execution without looking at the wider customer path.
You cannot make changes outside the campaigns
Your budget does not leave enough room to test and learn.
Success is defined only as more traffic or cheaper clicks

Blending Growth with innovation.
Navigation
Contact Us
Call Or Text: (916) 318-0373


© 2026 LN Marketing Services. All Rights Reserved